I get asked to explain the Under Cloud a lot, and it’s something I look forward to, because it’s a chance to hone the explanation, such as:
Connecting the things we learn to the things we create.
Or:
The ultimate research assistant.
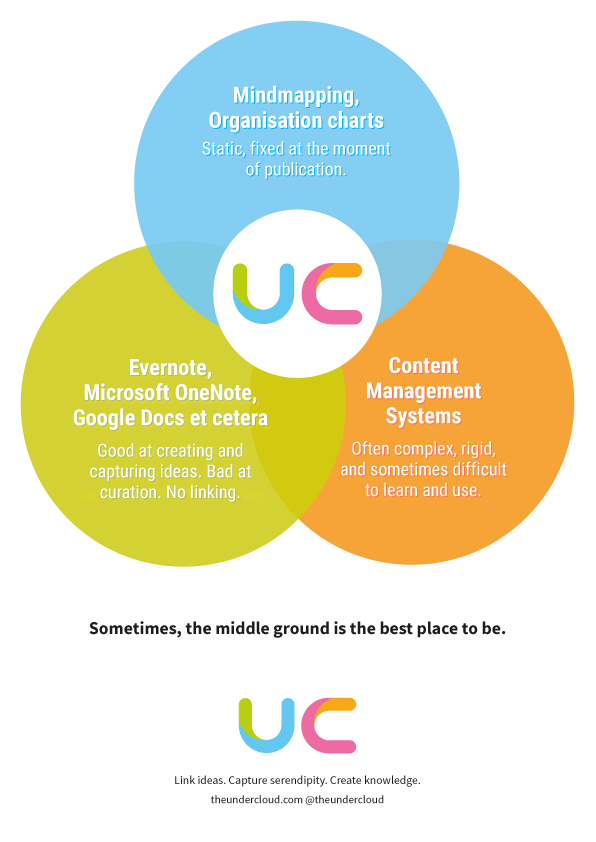
But then a graphic — or in this case, a Venn diagram — does an excellent job.